

written by Kansas City Regional Clean Cities Coalition director David Albrecht
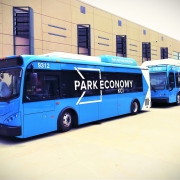
Kansas City International Airport is no stranger to cleaner fuels. It began deploying compressed natural gas (CNG) buses back in 1997, providing natural gas on site with its own high-speed fueling station. This made the Aviation Department something of a pioneer in alt-fuel adoption. The next step, though, was a big jump in fuel efficiency, and in October of 2017, KCI became the first US airport to deploy all-electric shuttle buses. It’s currently running 7 BYD K7 battery-electric shuttles along with older CNG units.
There’s no getting around the fact that up-front costs for electric vehicles are going to be higher than for equivalent conventional buses. In fact, when the airport rolled out data on the comparative costs of different fuels, the contrast was stark. A brand-new diesel shuttle buses cost about $385,000; for CNG, add an additional 14% for a sticker price of $440,000. All-electric models come in at a fairly eye-popping $540,000, more than 40% more expensive than the price for a baseline diesel.
But as anybody who’s bought a car knows, the sticker price isn’t the only price. The sticker price, in fact, is only the beginning of years of recurring costs. Kenny Williams is the Fleet Asset Manager for the Aviation Department and one of the main proponents of the EV deployment back in 2016-17 as the project began to take shape. He broke it down as follows:
Maintenance costs add up quickly for the shuttle bus duty cycle. Oil changes for CNG units are about $170 and have to happen every other month. Annual tune-ups add an additional $3,800 to CNG bus operating costs. So, even with fuel at an economical $0.50/gallon thanks to the clean fuel tax credit, CNG bus maintenance per year comes in between $4,800 and $5,000 per unit. It’s not like EV buses float on air. Like CNG units, they need new tires, and fluid changes every 18 months add annual costs of about $165 per year. But no internal combustion engine means no tune-ups, avoiding the lion’s share of regular maintenance overhead.
And yet, even with maintenance savings of around $50,000 per bus over ten years, there’s still a big price gap between diesel, CNG and electric buses. That’s where federal clean-fuel funding comes in. Thanks to support from the US Department of Energy, KCI was eligible for reimbursements of $72,000 per bus, dropping their costs to just $2,000 more than comparable CNG shuttles.
The same grant, “Accelerating Alternative Fuel Adoption in Mid-America” provided funding for charging infrastructure, covering about $100,000 of $225,000 in construction and equipment costs for the new systems. KCI’s electric bus charging lot has eight pedestals installed, with space for an additional four slots if more EV units are purchased. Charging time is about three hours, and this “fueling” process hasn’t had any negative impact on operations.
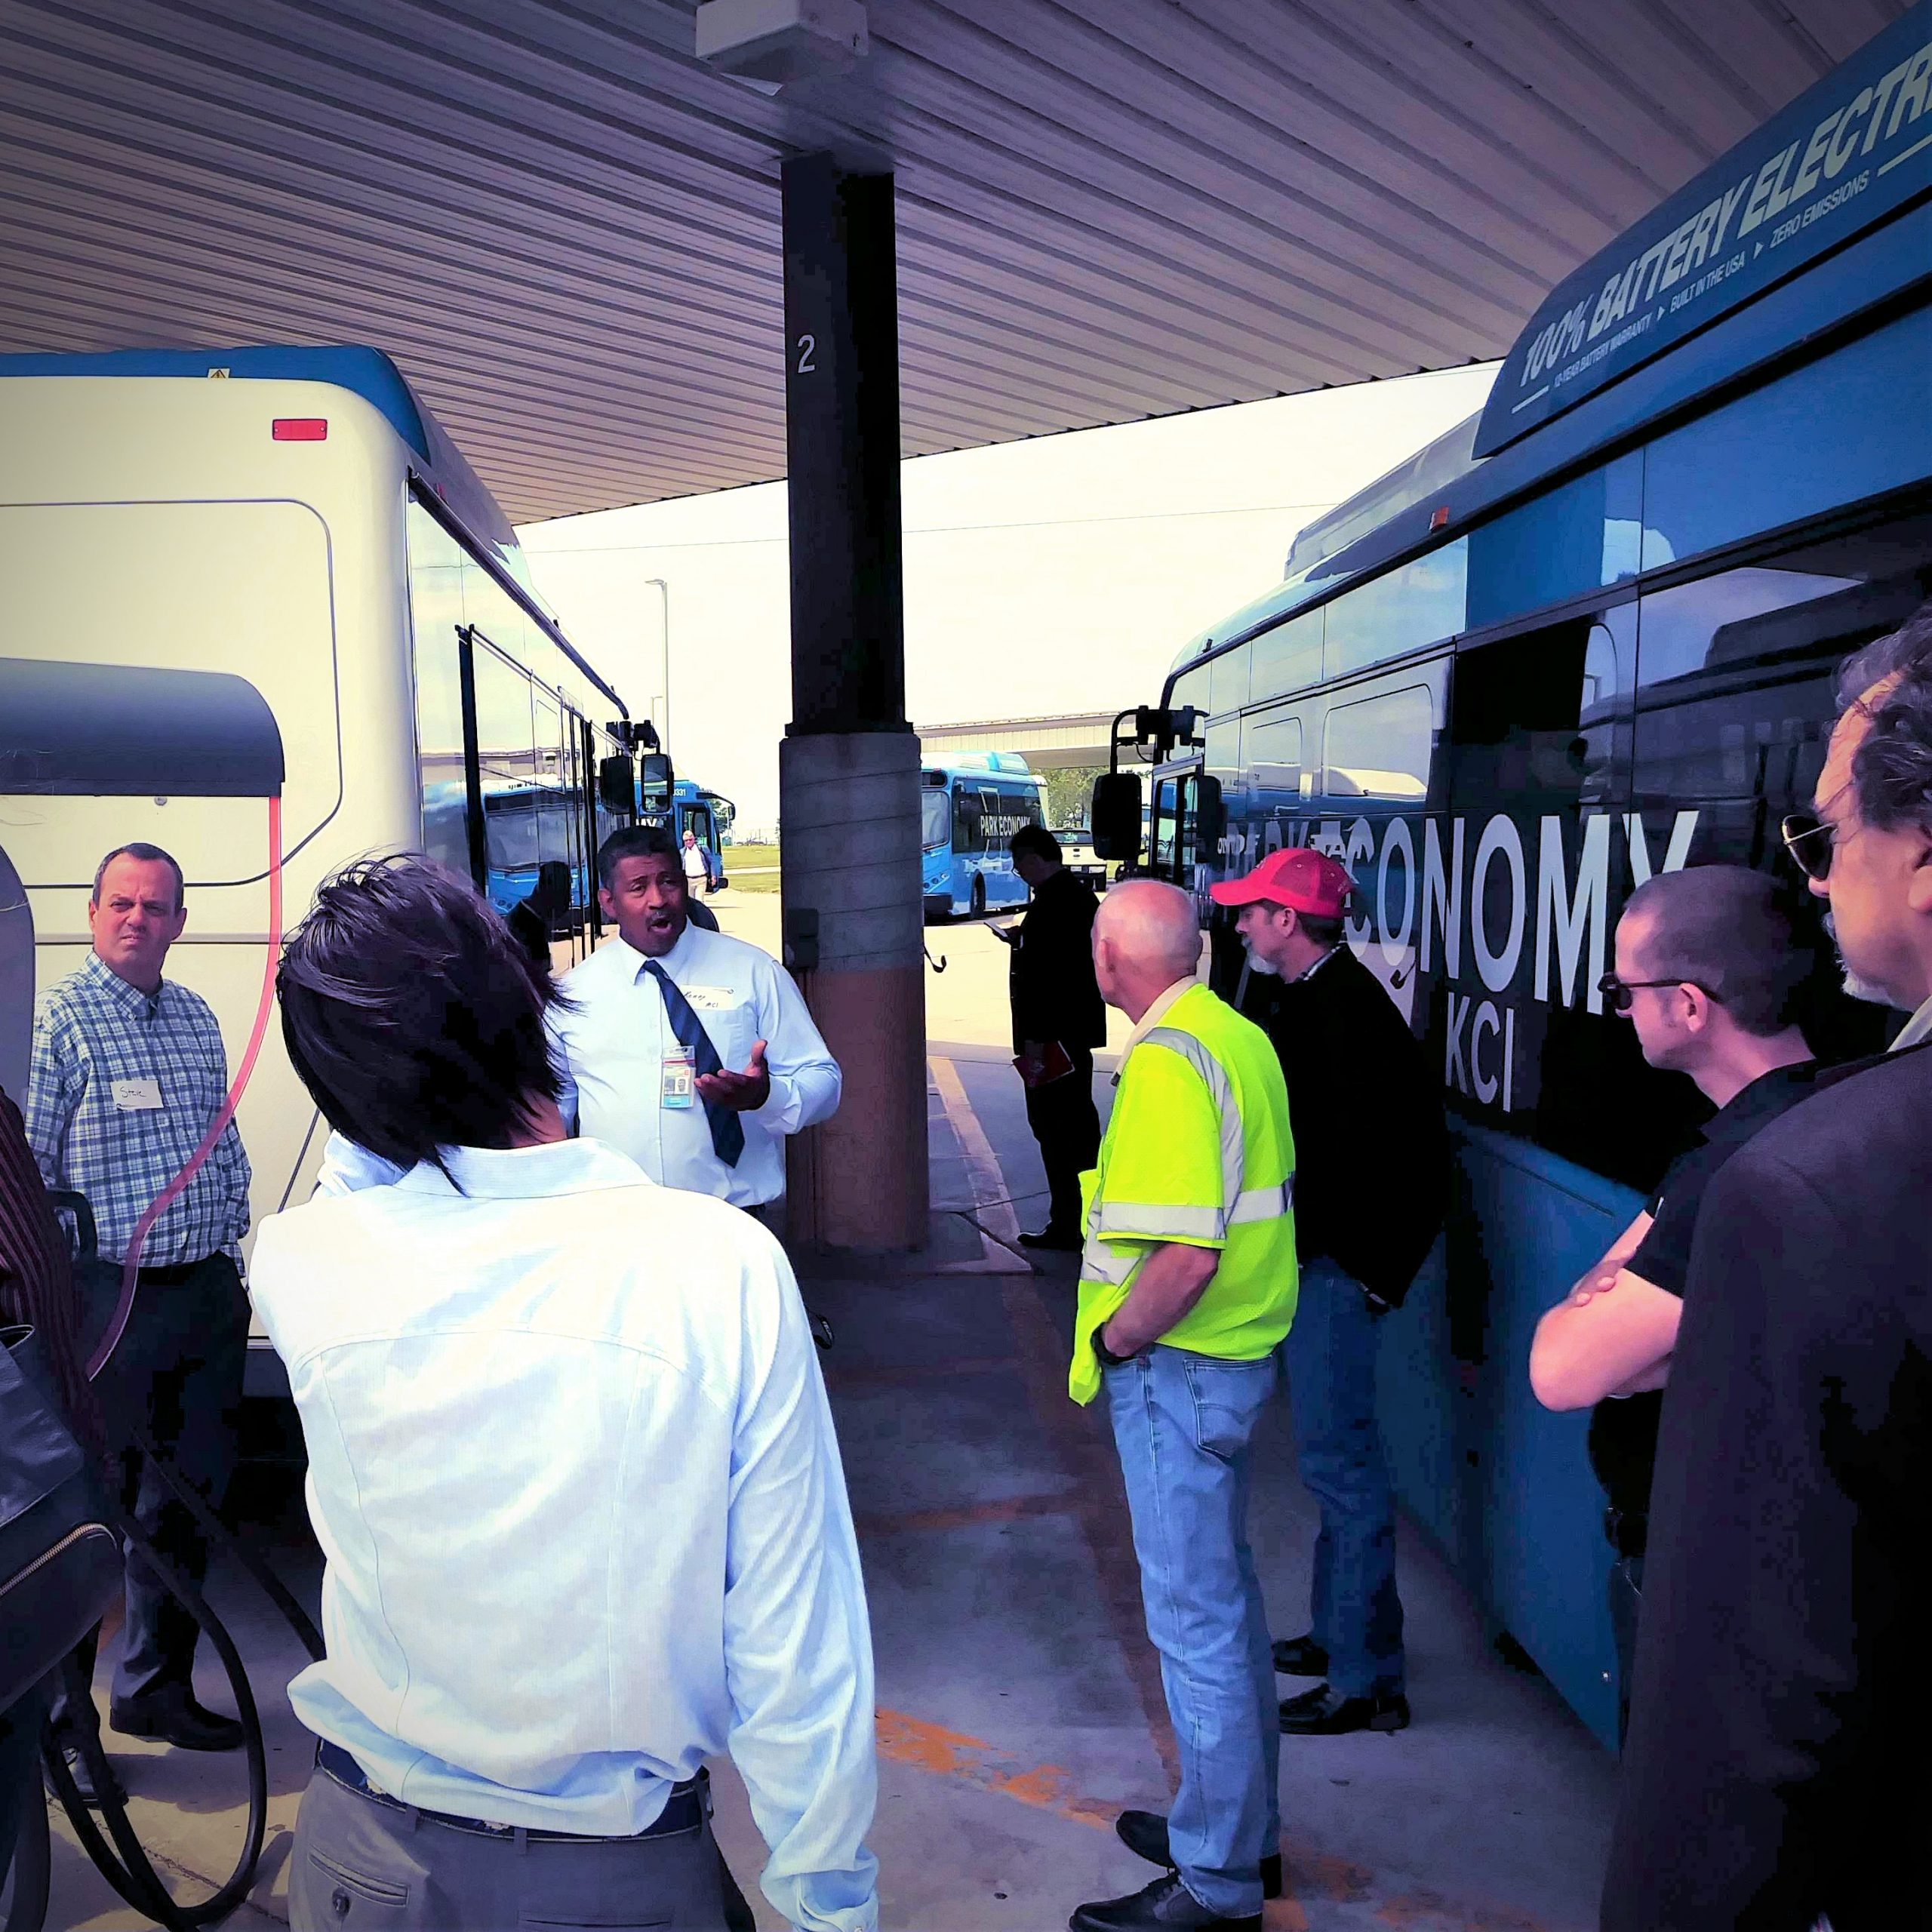
Kenny Williams talks EV bus duty cycles at the airport’s charging lot.
What has the driver response been like? Per Kenny Williams, “For most drivers, once they drive them, they really like them.” The only minor hitch has been how drivers operate the bus HVAC systems – since they are battery-driven, power loss from cranking up AC or heating at full throttle can take a bite out of driving range when a gentler touch would work better. And KCI is planning on investing in additional EV units. The economic toll of the pandemic has postponed acquisition of a few of the 12 units originally planned. However, the Aviation Department is planning on ordering three more units in addition to the seven already in service. These new buses will be slightly different. They’ll have inductive charging systems, which will let them power up without cords or plugs, as they pick up passengers at the new terminal starting in early 2023.
This material is based upon work supported by the U.S. Department of Energy’s Office of Energy Efficiency and Renewable Energy (EERE) Vehicle Technologies Program under Award Number DE-EE0008262 .
written by Kansas City Regional Clean Cities Coalition director David Albrecht
Metropolitan Energy Center (MEC) announces the first placements of all-electric zero-emission Class-8 yard trucks into service under a new grant project. The project, “Electrifying Terminal Trucks in Unincentivized Markets,” is the result of partnerships from Kansas City to Chicago, whose goal is to electrify terminal trucks in our regional market. The first placements of four planned have taken place at funding recipient Firefly Transportation Services. Based in Glenview, IL, Firefly provides zero-emission transportation options to freight yard, port and cargo sites, along with training and site preparation for all-electric operations.
The vehicles funded under this grant are manufactured by Orange EV. Based in Riverside, MO, Orange EV designs and manufacturers all-electric yard trucks right here in the heartland. They are also the first American company to commercially build, deploy and service 100% electric Class-8 electric vehicles. Before this year, Orange EV had yet to deploy one of their vehicles in the Kansas City area. Jason Dake, Vice President of Legal and Regulatory Affairs at Orange EV stated, “Not selling one of our trucks in our own backyard was a thorn in our side for a while,” he continued, “Seeing additional trucks deployed in the metro area through the project is a great feeling and most importantly, they are helping our community and improving the air quality for Kansas Citians.”
Additional funding recipients with all-electric truck placements planned in the near future are the Johnson County Wastewater Department in Leawood, KS and Hirschbach Motor Lines, a private long-haul carrier with emphasis on refrigerated and other specialized services. Hirschbach will deploy their truck at a client site in Wyandotte County, KS. Both Evergy and the Unified Government of Wyandotte County, Kansas City, Kansas Board of Public Utilities will provide technical assistance, as needed, on electrical service and electric rate guidance.
Orange EV will also take possession of a demonstration truck to provide potential customers across the U.S. up to a 2- to 4-month trial period. During the period, they can use the tractor free of charge, viscerally demonstrating air quality, noise-reduction and cost-savings benefits in their unique work environments.
Yard trucks (also known as hostlers, terminal tractors, goats or mules) are designed to pull cargo containers and semi trailers in freight or intermodal yards, or at large manufacturing sites. The workload for these trucks is intense, pulling heavy loads almost continuously. The power required means that most yard trucks are diesel, which results in a great deal of diesel exhaust, one of the worst pollutants and a major source of poor air quality. Diesel exhaust is not only a health risk for workers on site, but it also threatens communities surrounding industrial zones, typically low-income neighborhoods. Even worse, low speed, high-power operations emit much more soot and other particulates than diesel operations at highway speeds. Systematically replacing diesel yard trucks with electric models could substantially boost air quality in and around America’s busiest freight hubs. At the same time, the cost savings both from eliminating diesel fuel and from operating a much more efficient electric powertrain is an attractive advantage.
However, the project is not only about improving air quality and saving money. Another key goal is to gather data on electric truck operations to validate broader deployments of battery-powered yard trucks. Telematics and data, supported by fleet interviews and operational evaluation, will be analyzed by another project partner and nearby neighbor, Missouri University of Science and Technology. Ultimately, MEC will create a deployment guide based on the real-world experiences of our project partners in Chicago and Kansas City so fleet operators across the country can make the move to cleaner, more efficient freight handling.
To learn more about this project or to request the demo truck for your work site, please contact Emily Wolfe.
This material is based upon work supported by the U.S. Department of Energy’s Office of Energy Efficiency and Renewable Energy (EERE) under the Award Number DE-EE0008887.

written by Emily Wolfe, MEC’s Senior Public Affairs Coordinator
As we near the end of the year, it is anticipated that Congress will be discussing whether to extend certain federal tax credits such as the Alternative Fuel and Energy Efficiency Tax Credits. Contact your representative to learn if they will support extending the Alternative Fuel Tax Credit and below energy efficiency tax incentives that also expire at the end of 2020. (Note that biodiesel credits are covered under the Biodiesel Income Tax Credit which continues through December 31, 2022. The Renewable Energy Tax Credits expire December 31, 2021.)
If you would like additional information regarding the above incentives visit the Database of State Incentives for Renewable Energy (DSIRE), email your Clean Cities coordinator, or contact MEC at (816) 531-7283.
written by Kansas City Regional Clean Cities Coalition director David Albrecht
Electricity is tied to our lives in a way you might not expect, and not in the sense of necessity or convenience. Instead, our daily behavior, waking and sleeping, dictates how utilities generate power. As we wake up, hit the lights, fire up the microwave or turn up the furnace, demand rises. Through the day, generation increases to meet our needs. Demand peaks in late afternoon and starts dropping at 6:00 or 7:00 in the evening as we leave the factory or office and head home. This cycle changes with the seasons, with our use of air conditioning pushing demand to its annual high in summer. It also varies from region to region.
But whatever the season or region, from around 11:00 PM to 7:00 AM, electric utility output is at its lowest. This nightly low-level output is called baseload generation – the minimum needed for essential systems that run continuously – and it never stops. Baseload plants, typically coal or nuclear, run near or at capacity nearly all the time. They’re the biggest power plants since the formula “Bigger = Better” makes economic sense for systems in continuous operation. These plans are extremely efficient. They also run continuously because baseload plants are ferociously expensive. KCP&L (now Evergy) completed its 850 MW Iatan coal plant in 2010 at a cost of about $2 billion. The more continuous hours a plant that big and expensive runs, the sooner it can be paid off. Nuclear plants are far more expensive, but that’s a story for another article.
There’s another reason that coal and nuclear dominate baseload generation – time. As demand for electric power grows through the day, there’s no reason that it can’t be met by increasing output at another coal or nuclear plant. The question is how many hours or days later that electricity will arrive. It takes days to bring a nuclear plant from a cold shutdown to full power, and up to eight hours for a coal plant to hit peak output even from a warm start. On a 100F summer day, as air conditioner use spikes quickly to beat the heat, utilities don’t have hours to spare. That’s why a second breed of power plants exists – peaking plants, designed to quickly provide electricity above and beyond baseload.
Peaking plants are a very different animal from their baseload cousins. They’re generally smaller, and typically operate using natural gas or pumped hydroelectric storage, depending on location. They only operate for a limited number of days every year – as little as 10% of the time. They’re also much faster to respond to demand spikes and can start generating power in five to ten minutes. But speed has a price – they’re also far less efficient than baseload plants.
As demand rises, utilities have to produce more power. They have three options – producing more from what’s already online, bringing additional plants into service, or buying it from other utilities. All three options cost money. That’s why, as part of an overall movement towards deregulating electricity markets, some utilities now charge different prices for electricity, depending on when it’s needed. Peaking power at 4:00 PM in August is much more expensive than baseload power at 4:00 AM in January. On the other hand, if a utility has a surplus, they can sell it for far more. This evolving market is one of the reasons the industry is changing rapidly.
“There is nothing simple about operating a power grid.”
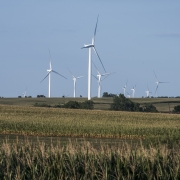
Other rapid changes are shifting the baseload baseline. One key reason is renewable. Other than the rapid growth in natural gas in the last 30 years, the big story has been wind. From producing very little at industrial scale as recently as the year 2000, wind energy now produces more power than hydroelectricity. But wind energy is generated at Nature’s pleasure. When the wind really blows, the question becomes what to do with all that surplus power. And when the wind doesn’t blow, what are the best resources to handle the load? Electricity isn’t water or soybeans or money – it can’t be stored at scale, at least not yet.
These are the challenges facing the power industry today as it adjusts to advancing energy generation technologies. Grid integration or smart-grid tech is an emerging technology capable of managing the challenge. It can handle variable amounts of energy from renewable sources, finding ways to store electricity, and maintaining reliable power supplies, meeting one of the biggest infrastructure and tech challenges we’ll face this century. Stay tuned. We’ll provide more detail on that promising solution, and more, in forthcoming articles.
written by Kansas City Regional Clean Cities Coalition director David Albrecht
You have power.
Your access to energy would have cracked human credulity for most of our species’ time on earth. For millennia, we elbowed away the margins of night with the smoking glow of wood, grass or buffalo chips. Just 200 years ago, whale oil and candles lit the homes of a slowly industrializing world—for those who could afford them. For those who couldn’t, wood remained the main source of light, heat and cooking, along with the coal that drove that industrialization. Now, in an eye-blink of human history, we have become the beneficiaries of a world in frenzied motion.
The energy we use never stops moving. It hurtles from point to point at velocities approaching the speed of light. It slowly plows the oceans in ships big enough to dwarf the fever-dreams of Pharaohs. It is explosive coal dust shot into a furnace, feeding flames five stories high hot enough to melt platinum. It is water roaring 600 feet down a pipe, turning a generator the width of a small house 100 times per minute. It is mazes of pipes and conduits, steam and heat, toxic and explosive chemicals, all combining to refine Jurassic sunlight into jet fuel and gasoline. It is today’s sunlight knocking electrons out of their orbits and into batteries and wires. It is the fission of a single uranium atom unleashing enough energy to make a grain of sand visibly jump, triggered by a neutron moving 1.4 miles per second in reactor spaces unimaginably dense with such reactions. This frenzied motion never stops, only occasionally slows, and makes our world—food, music, lighting, medicine, communications, trade, everything—possible.
As Americans, how does all this shake out? What drives our nation’s energy system today, and what will that system look like tomorrow? And what kind of future do we face as the consequences of this vast, and amazingly productive disruption become clearer? These are the kinds of questions this continuing series of short essays will try and provide some answers to.
We are Metropolitan Energy Center. Part of our mission is to present the best information available on energy, its principles, power and drawbacks, whether it’s heating your house or powering your car. We’ll be covering a lot of ground–from the grid to the feedlot, and from alternative fuels to solar technology. We’ll touch directly on the projects we pursue and probe larger questions of energy policy. We hope that in the process we can hold your interest, provide food for thought, and perhaps puncture a few myths about what new technologies can and can’t do.
Things are already moving fast, and we hope you’ll hop on board for this excursion.
written by Kansas City Regional Clean Cities Coalition director David Albrecht
To the casual observer, battery-electric vehicles (BEVs) appear nestled comfortably on the upslope of a growth curve that would turn other industries green – with envy, in this case. From a global grand total of about 20,000 EVs of all makes on the road in 2010, by 2019, the total number of plug-in hybrid (PHEV) and full electric autos on the road worldwide rose to 7.2 million. That’s an almost a 360-fold increase in less than a decade.
The biggest surprise to date has been the number of surprises to date. Who imagined that an automotive startup – the first such large-scale attempt since Kaiser-Frazier back in 1947 – would flat-out pound legacy OEMs in the US in any market segment? In 2019, Tesla’s three all-electric models outsold GM’s EV/PHEV Bolt and Volt combined by nearly nine to one. Also in 2019, the California upstart commanded more than 78% of US BEV market share.
Who imagined that battery costs would continue to collapse at the rate we’ve seen through 2019? In 2010, battery costs per kwh averaged about $1,100 – in 2019, they hit a new low of $156. Who imagined that price parity between EVs and conventional ICE models could arrive in some market segments by as soon as 2022, 2023, or 2025? What year, of course, depends on whether the crystal ball you’re consulting belongs to Deloitte, Roskill or Carnegie Mellon University.
It’s this last bit – predicting the crossover– that we want to take a look at today. Not surprisingly, it’s complicated. Total cost of ownership for an EV can be substantially lower than for an ICE car. With simple drive trains, EVs have fewer points of failure, and electricity is cheaper than gasoline in most industrialized nations. Tax incentives and rebates can substantially sweeten the pot. But in the words of a recent Automotive News article, mass EV adoption is “inevitable, yet elusive.”
Multiple factors are in play. Infrastructure buildout is slower than it could be. Manufacturers may increase their margins once EVs hit a tipping point, given the substantial sunk costs they’ve already incurred. Moving the needle on consumer acceptance is still difficult. Though we’re expecting the arrival of multiple EV models by multiple OEMs by 2023, 14 different brands didn’t offer a single EV option as recently as the end of 2018. And there’s still a rough $6,000 – $9,000 gap between EV models and their ICE counterparts in non-luxury categories. In the end, it may be mandates that do the heavy lifting. For all of the reasons above, and given Americans’ aversion to mandates, IHS Markit projects 40% of EU cars will be hybrid or pure EV by 2031, compared with 20% of the American passenger fleet.
Above and beyond the usual suspects, there’s one you might not have suspected – reliability. At least in the US, drivers are holding onto their cars longer than ever, thanks in part to better quality. By this July, the average age of an American car was a record 11.9 years, and per IHS, one in four cars on the road in the United States are more than 16 years old. This is something of a tribute to improved automotive quality: as noted in the article linked above, “Back in the ’90s, one-quarter of cars parked at the grocery store were not Ford Mavericks and Chevy Vegas. Nowadays, that beige 2002 Corolla is still ubiquitous.”
With COVID driving economic worries for consumers, auto purchases may be viewed as more discretionary than ever, particularly when it comes to buying a new car. At the same time, until the pandemic is under control, road trips (vs. flying) and commuting by car (not public transit) may keep long-term auto demand simmering, even as our wheels continue to gray. How all of the preceding will drive EV acceptance in the next few years is hard to forecast, but we’ll be watching closely.
Since January, there’s been a lot of discussion, analysis and 151-proof worry about the COVID virus – understandably. Viral impacts have produced (in less than six months) the biggest economic implosion since the 1930s, public health lockdowns spanning the planet, and a global death toll of (at this writing) 434,388, with nearly 116,000 of those confirmed deaths in the United States.
As you’d expect, there has also been a certain amount of silver-lining searching. It’s only natural – as human beings, we look for the lesson, or what we could have done differently or what we might gain in times like these. And with cars off the road and factories closing down, citizens of cities as remote from one another as Los Angeles, Beijing and New Delhi looked out the window and realized something truly strange was happening – the air was cleaner than it had been in years, even decades. This four-minute clip from CBS has visuals that I won’t try to convey via keyboard. For many, the spectacle of suddenly invisible (a.k.a. “normal”) air was startling.
With that kind of obvious impact, the next Big Question didn’t take long to surface: if substantially shutting down Normal looks like this, what kind of impact is it having on the climate? The early returns are in, and the answer is – not much. NOAA reports globally averaged CO2 content of 417.07 ppm (parts per million) for May – up from 414.65 ppm in May 2019 and 411.24 ppm in May 2018. There’s science behind this lack of change. Earth, in effect, breathes – this was Charles Keeling’s great discovery in the late 1950s. Atmospheric CO2 content rises and falls each year, bottoming out in October as most of Earth’s landmass hasn’t yet released carbon dioxide before the northern winter, and peaking in May before northern hemisphere forests have really begun to reabsorb it. This means that COVID’s clean air aftereffects hit just as seasonal CO2 growth approached its peak.
Early estimates are that pandemic shutdowns led to an 8% drop in anthropogenic CO2 output, and that it would take 20-30% reductions for at least six months to put a dent in atmospheric readings. As climatologist Katherine Hayhoe notes, imagine all the carbon we’ve put into the atmosphere as a pile of bricks. We’ve been piling them up for about 250 years, more or less, and cutting a slice from latest brick dropped on top of the pile doesn’t make that much of a difference. And we’re already seeing a rapid rebound in human CO2 output; “Things have happened very quickly”, in the words of one climatologist tracking current conditions as economic activity ramps back up again.
So if even something as disastrous as COVID can’t substantially alter the pace at which CO2 continues to pile up in the planet’s atmosphere, what will? And if all the efforts made to clean up our energy act to date haven’t materially changed things, what can? It would be easy to throw up our hands and assume that this spring’s lack of substantive results represents something permanent.
It doesn’t.
We are at an inflection point in how we produce and use energy and the pace of change is only accelerating. Coal, the dirtiest source of electricity, is dying in multiple major economies. June 10th marked 61 straight days that the United Kingdom didn’t generate one kilowatt from coal. COVID has cut demand, so that and an unusually sunny May are part of the story, but the UK’s power grid has fundamentally changed. A kilowatt of electricity cost as much as 600 grams of CO2 in 2012 – this spring, as little as 125. And this took place even as the country’s population grew from 64.5 million in 2012 to 68.9 million this year. In the US, electric output from all renewables surpassed electricity from coal for the first time since the 1880s, and coal has essentially collapsed as a utility fuel – from a peak in 2008 at around 23 quads (Quadrillion BTUs), it’s now producing around 12 quads, as the graph at the link above powerfully illustrates.
And it isn’t just a question of generating electricity. Large-scale battery storage, a long-time dream of clean power advocates, is expanding rapidly. 15 small-scale 9.95 MWh systems will support peak generation while smoothing out price spikes in Texas, and the state symbolized by the oil rig is already the nation’s leading wind generator. In California, PG&E is negotiating 1.7 GWh of storage with the state – more than ten times the power of the Texas sites mentioned above. Perhaps the single most striking change is the cost of solar energy; between 1980 and 2012, the cost of solar modules fell by a stunning 97%, and those costs keep dropping, just as solar cell efficiencies climb to as high as 47% in some experimental designs. Underpinning all of this is a simple, unignorable fact – renewables are now less expensive than fossil energy sources. Markets are responding – unevenly in some locations, swiftly in others but responding all the same.
The task that remains is immense. There is considerable doubt whether the goal of limiting further warming to 1.5 degrees C to avoid the worst of potential climate damage can be reached. There isn’t all that much time left. Lofty pledges of zero-emission goals by companies and countries by 2050 are fine, but we’ve already used up 1.5% of the time remaining between 2020 and 2050 to achieve those goals. And yet, for the first time, there now appear to be enough tools on the bench – technological and economic – to let us get started on meaningful work.
So, when we talk about someone employed in “clean energy”, what does that cover? Like “manufacturing”, many things. The Bureau of Labor Statistics (BLS) defines and tracks employment by sector, but it’s not the most user-friendly resource. So, while BLS notes that there were nearly 6,000 wind turbine service techs employed in May of 2020, it divides them among five different industries, ranging from utility construction to consulting to local government. Sadly, a BLS plan to categorize and track clean energy jobs begun in 2010 was abandoned in 2013 during a federal budget shutdown, and has never resumed.
More generally, clean energy jobs fall into four broad categories – energy efficiency (home upgrades or commercial building retrofits); renewables (solar, wind, biogas, or geothermal energy); grid and storage (electrical engineering, battery tech, and charging stations); and cleaner vehicles and fuels (hybrid and electric vehicle manufacturing or biofuel production). Altogether, more than 3.3 million Americans work in one of these fields, and it’s worth noting that energy efficiency alone employed more than twice as many people as all fossil energy sectors combined.
Like nearly everybody else, clean energy workers have taken a hit in this economy. About 147,000 jobs were eliminated in March, and April totals nearly tripled that. More than 590,000 jobs in the sector evaporated by April 30th, two months ahead of projections by BW Research. The same analysts now expect around ¼ of all green energy jobs to be gone by June 30th, some 850,000 in all.
Under the circumstances, this isn’t surprising. Homeowners are unlikely to invite insulation crews into their homes in the midst of a pandemic. Financial chaos means that banks are less likely to lend on large-scale clean energy deployments. Cities facing budgets collapsing under tax shortfalls are going to emphasize essential services before clean energy buildouts. And utilities are facing tumbling energy demand. IEA estimates that from February through April, global demand for energy dropped 6%, the equivalent of all of India. American energy demand is set to drop 9%, according to the same report.
Whatever the course of economic contraction and recovery, there are certain irreducible advantages to jobs in these industries. To begin with, they tend to be site-specific. Many renewable energy jobs are unlikely to be outsourced – those building and maintaining a thermal solar plant in Arizona, for example, are going to build and maintain it in that location for its useful life. The same holds true for energy efficiency professionals – the homes and buildings in the United States aren’t going to offshore themselves.
Many skilled green energy jobs pay relatively well, can boost stressed economies and don’t require four-year degrees. Wind turbine techs, for example, exemplify this beneficial clustering. Wind turbines require regular service and maintenance, and wind farms are located largely in rural areas in the Midwest and southern Plains. Technicians tend to live in smaller cities or towns near these sites, supporting the local tax base. Median income for a turbine technician in 2019 was $52,910, which could go a long way in Russell County, Kansas or Alliance, Nebraska. And training for the field takes one or two years, depending on program and specialization. Median income for solar installers was lower, but in 2019 stood at $44,890 per year, and for insulation crews, median income in 2019 was $44,180,
The issue, at least for now, is that the three specific categories mentioned above don’t employ very many Americans – about 75,000 in all in 2018 and 2019, according to BLS. But broaden the focus, and green energy’s economic becomes clearer – and bigger. Wind energy’s total economic footprint alone is already substantial. In 2018, 530 plants in 43 states produced components – blades, nacelles, turbines, gearing and digital control systems. Outsourcing of some of this manufacturing is possible, but given the size and weight of components as turbines grow taller, is likely to remain largely here at home. Moreover, the Department of Energy estimates as many as 600,000 jobs in all subsectors of wind energy in less than 30 years.
This kind of job generation potential is what makes remaking America’s energy system so important to inclusive economic recovery. Utilities, states and cities are already beginning to implement plans to change how we generate and distribute energy in a carbon-constrained world. These efforts have been patchy and slow, and to date unlikely to meet even minimal Paris Agreement standards. But under the right circumstances, policy changes, like technological changes, can happen quickly. Emphasizing the very real benefits of more clean energy jobs may help speed that vital process.
 Photo by: Anissa Parra-Grooms, Metropolitan Energy Center
 Dennis Schroeder / NREL