written by Kansas City Regional Clean Cities Coalition director, David Albrecht

There’s a lot to like about electricity from hydropower.  It produces zero emissions.  It can respond quickly to sudden increases in demand.  A dam can also protect against floods, store water to fend off drought, slake the thirst of cities and irrigate cropland while generating clean energy. 

The Age Of Dams

Dams can even serve as sources of national inspiration.  In the depths of the Great Depression, building Boulder Dam (now Hoover Dam) didn’t just provide thousands of desperately needed jobs.  The project made news.  It was the biggest dam ever tried, built in a searing desert environment.  Vital engineering problems were solved with construction already underway.  And it was proof that even during tough times, Americans could undertake big, ambitious projects and succeed.  10,000 spectators turned out in 102-degree heat when FDR dedicated the dam in September 1935, a job completed under budget and two years ahead of schedule.
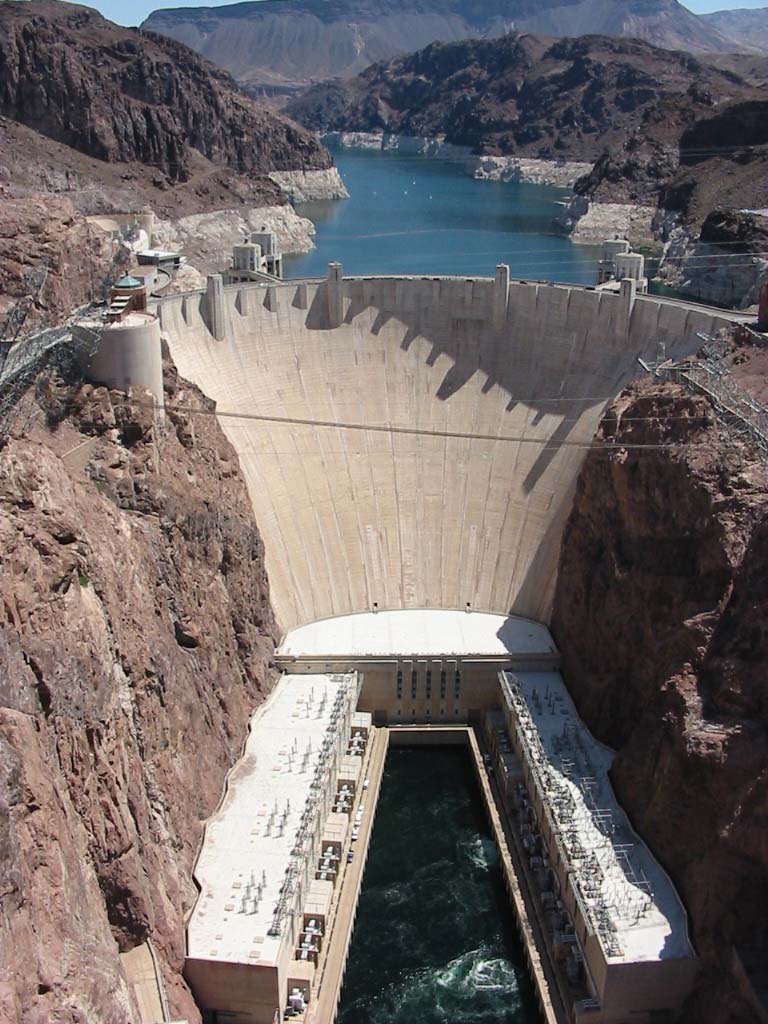
Hoover Dam – Arizona/Nevada

Hoover Dam marked the start of what some have called the Age of Dams.  From the 1930s through the early 1980s, America built thousands of large dams.  Some are truly huge (like Grand Coulee on the Columbia), some just garden-variety big.  These structures rerouted rivers, irrigated vast areas of land, and made desert cities like Phoenix, Los Angeles and Las Vegas possible.  There are now about 100,000 large dams nationwide, 5,500 of them 50 feet high or taller.  In 2019, America’s 2,400 hydropower dams generated 274 billion kilowatt-hours, a shade under 7% of all of our electricity.  So, given all the benefits dams can provide, why aren’t we using more of this clean energy source?

Location, Location Location

It’s complicated.  As implied above, only a small minority of dams provide power, and the biggest dams are federal projects.  For these dams, there’s a kind of legal division of labor between multi-purpose dams providing power, storage and irrigation, and flood-control dams.  Flood-control dams can generate power, but that’s not their main purpose.  Example – the vast Fort Peck Dam in Montana has a volume of 96 million cubic meters, and generates 185 megawatts of power.  Grand Coulee Dam has one-tenth the volume – 9.1 million cubic meters – but maximum electrical output of over 7,000 megawatts – 37 times more than Fort Peck.  Different rivers, different sites, different designs – and different reasons for being.  Fort Peck was designed for flood control, with some generation capacity.  Grand Coulee was all about power.  Could existing dams be retrofitted to generate more power?  Possibly, but at high cost, and at the expense of other missions they’re required by law to fulfill. 

In a sense, geography is in control.  There are only so many rivers that are big enough to dam.  On each of those rivers, there are only so many sites that make sense. Even then things don’t always work out.  A case in point – Optima Dam.  Sited on the North Canadian River in Oklahoma, Optima was completed in 1978, after 12 years of planning and construction.  Today Optima Lake is effectively empty.  The North Canadian was once fed by underground water from the Ogallala Aquifer.  But over time, farmers have pumped so much water from the Ogallala for irrigation that there’s now nothing left for the river or the reservoir.  Beyond extremes like this, nearly all the best locations were developed during the Age of Dams.  What sites remain are, for the most part, remote, expensive or potentially dangerous.

Approaching An Age Of Extremes

There’s also maintenance.  Dams look massive and unchangeable. But they’re subject to the ravages of time like we are (it just takes longer).  By 2020, more than 70% of all the dams in this country were more than 50 years old.  Really big hydropower dams like Hoover, Bonneville or Shasta are regularly inspected by federal authorities, but they’re the exception to the rule.  And even these kinds of massive structures are now being put to the test by more extreme weather events.  Oroville Dam in California faced disastrously sudden melting of a heavy snowpack in 2017. The result was an overloaded spillway, 200,000 residents evacuated and a repair bill north of $1 billion.  The May 2020 dam failure in Michigan and the collapse of Spencer Dam in Nebraska during 2019’s intense “bomb cyclone” are  examples of what can happen to older, smaller systems facing extreme stress without regular inspection.

Finally, dams have finite lives.  They may endure for centuries, but in the end, all reservoirs will fill with sediment.  In the Sierra Nevada, in hard rock terrain, a dam might endure millennia.  But in much of the American West, where soils erode easily and where flash floods roll car-sized boulders, it’s different.   Glen Canyon Dam on the Colorado was completed in 1963. It created a reservoir that could hold 27 million acre-feet of water.  Today that reservoir – Lake Powell – can hold about 24.3 million acre-feet when full. That missing 10% – enough to cover 2.7 million acres with one foot of water – cannot be replaced, because there’s mud and sand where water used to be.  The original capacity of Lake Mead, behind Hoover, was 32 million acre-feet. Today it’s down to 25.8 million – a loss of almost 20%.  Ongoing drought, like the Colorado River basin is now experiencing, also limits electricity a dam can produce.  The deeper the water above the turbine, the greater the energy output – and vice-versa.  As reservoirs fall, so does potential power output.  In a region where entire states depend on these dams and lakes, and the power they produce, these physical limits are becoming visible.
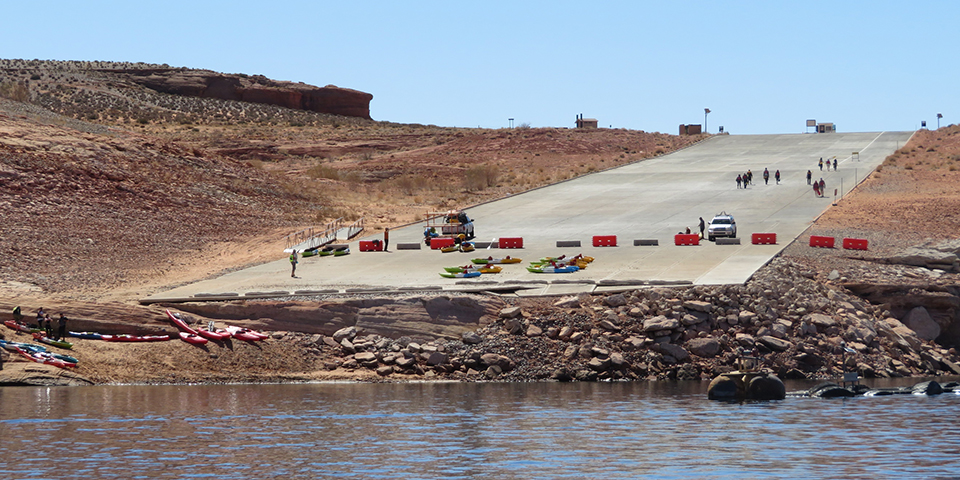
While the big picture may look a bit bleak, boosting clean energy output using existing infrastructure may be possible – while stabilizing the grid at the same time.  At peak generation, California solar and wind power output is now so large that the state at times is forced to give away electricity.  What if that renewable energy could be used to pump water from the Colorado back up behind Hoover Dam to generate more power?  In effect, this would use the dam as a kind of battery, without the need for actual batteries.  It wouldn’t be cheap.  The Los Angeles Department of Water and Power, which supports the concept, estimates a cost of $3 billion, but these kinds of retrofits may be a path forward for enhanced hydropower generation and a more reliable electrical system.

We are funded by readers like you. Even $5 helps expand clean energy access.
Your donation helps scale new technologies—tools that are public-ready, but only utilized by people of moderate affluence at a minimum. Clean-energy technology is a game changer, not only for the planet, but also for small businesses and low-income households. Thank you for helping to broaden clean tech's horizons.

written by MEC’s Buildings Department program manager, Mary English

One of the things I love about my profession is the fact that I learn new things regularly. My most recent new learning was inspired by the expression “April through October Houses” during an informative and entertaining radio interview with the host of Cowtown Conversations, Joseph Jackson, on his KKFI 90.1 FM show. He spoke this phrase in reference to homes in Kansas City that may be rented to tenants in the spring, only to have the leases broken when autumn’s chill settles into the air and the homes become too cold to inhabit. 

The topic deserving of Joseph’s surprising reference was easy building performance and home weatherization tips that anyone can handle. In light of my own epiphany about a previously unconsidered perspective, I’d like to expand on a few statements from that interview that we didn’t have time to cover. I feel that knowing these things about the task of making a building more energy efficient would help even the most cash-crunched households achieve warmer homes and better health. 

1 “April through October” conjures thoughts of beautiful spring and fall colors—not to mention nicer weather—sandwiching the summer months of what can be oppressive heat in the Kansas City region. So when Joseph alerted me to an expression that is in among renter vernacular, all I could think was, “If these homes are so uncomfortable that the occupants have to live elsewhere in the winter, they also must be enduring some serious discomfort in June-August as well.” As I’ve been witness to many homes in need of repair and energy upgrades in a former life as a home energy auditor this is not a surprising revelation.

During the interview, we discussed home weatherization and tips for residents that have the money and authority to weatherize. But for renters, the weatherization task gets more difficult since renters don’t own their homes. The problem can be viewed as systemic—renters understand both the discomfort of an extreme indoor temperature and in most cases, the pain of a high utility bill that results when they try to return the home to livable temperatures. If the landlord is not empathetic or receptive to making energy upgrades for their renters? Voila: the April through October House has been enabled by an inequitable system of utilities being paid directly by tenants. 

Ethical and moral considerations aside, if only this class of landlord realized this key truth about building management, the April through October Home would likely evaporate: An efficient home leads to a better bottom line because it keeps renters who want to stay, instead of forcing them out due to unbearable discomfort. Energy efficiency upgrades don’t cost in the long run. They pay landlords back. The National Apartment Association estimates that high turnover can consume up to 9% of gross rental income for larger multi-family residences, so landlords would come out on top, if only their renters could continue living in the buildings.  

For those people reading who do own their homes—and pay their own utility bills—the return on investment for home energy efficiency upgrades is better than most financial products. Plus, we are not even addressing the healthcare costs endured due to medical problems caused by inefficient homes. 

Anyway, if I could wave a magic wand, I’d make all landlords cover the cost of utilities for tenants in their rent. This would incentivize the building owners to actually make improvements on their “April to October” buildings. Then they might want to actually make their properties as efficient as possible to save money, and realize lower turnover rates as well. Happy renters and wealthier properties owners: I’d call that a win-win. 

Mold growth on a windowsill.

Mold growth on a windowsill.

2 Speaking of weatherization, Joseph came prepared to talk about building improvements. In addition to his extensive experience doing his own energy retrofits, he had prepared a well-researched list to share with the program’s listeners. Things like caulking around windows, adding weather-stripping, and sealing the seams of exposed ductwork were all included and endorsed by yours truly. 

One more improvement on the laundry list, though, is adding window weatherization plastic to the interior window frame ahead of the heating season. In the interview, I did not get a chance to say, “If you add plastic to your windows, make sure you remove it in the spring.” This unvoiced sentence has been bothering me since the interview. 

Here is why: If you leave the plastic in place for the summer months, you may be inviting mold and eventually wood rot on any window trim or sill sealed in behind the plastic. (Perhaps you don’t open your windows ever and don’t think about it.)

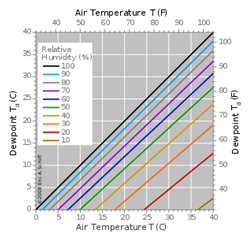
Dewpoint temperatures

How does this mold and wood rot happen? Well, it has to do with extreme temperature change between the hot and humid summer air outside, and the cool, conditioned air in the house, on the interior side of the plastic. In Kansas City, we get very high humidity which creates a dew point as low as your thermostat setting for a typical central air-conditioned house. That air hits sealed cold plastic around your windows and boom: condensation. Next comes the spores and then the mold growth.

So, remove that window weatherization plastic in the spring for health and durability’s sake.

3

This gets me to our conversation regarding professional energy auditors. The happy news is that there are low-cost audits to be had. In the interview, Joseph mentioned that he had received an energy audit for $35.00 by using Groupon. So I “Googled it” and there are indeed deals for Kansas City residents to get energy audits for that low of a price (or even lower) currently using online coupon services like Groupon.

These deals are advertising use of thermal imaging from one vendor, and another advertises “air leakage” testing. However, it is unclear to me if these deals reflect a product that is a full-scale comprehensive energy audit that includes a blower door test with a detailed infrared scan and carbon monoxide safety testing which is how I define “home energy audit.” To review or explain further, a full-scale home energy audit should take roughly two hours minimum – longer for larger houses – and include:

  • An infiltration test of the whole house using a Blower Door.
  • Thermal imaging once the testing is done with the Blower Door still operating to create a situation where a thermal camera can visually detect air leaks.
  • A natural gas line test; and carbon monoxide testing of all gas-burning appliances.
  • A report that shows images and gives an executive summary of recommendations with an estimated payback should these recommendations be executed by a contractor or homeowner.

Doing a bit more research regarding the market surrounding home energy audits led to me to realize that the industry looks a little differently than when I was regularly conducting energy audits for homeowners and contractors. Gone are the days where a consultant could offer the audit as a stand-alone product as the industry has adjusted to a loss of subsidized incentives. There are companies that do stand-alone auditing still, but most now are offering low or no-cost energy audits as what is called a “loss leader” product. In other words, the company offers audits as a lead into their other services of insulating your attic and walls, for example.

These professionals may be doing a thorough job of auditing your home, but if the end goal is to get you to buy their other products, what do you think their audit reports are going to be concentrating on for their list of to-dos? I am a big proponent of adding insulation, but the safety and blower door testing are important to make sure these upgrades are being done safely and correctly.

To reiterate, the change reflects the loss of subsidies from regional utility programs as well as robust tax breaks on the federal level to help homeowners pay for these services. Hopefully, that will be rectified by the current administration’s proposed Build Back Better program which is currently making its way through Congress and has $500 million set aside for home energy upgrades and contractor training. Homeowners, contractors, and the energy professional industry would be helped immensely by more subsidies, since it’s clear that most folks aren’t interested in paying $300+ out of pocket for a professional consultant to conduct a full-scale home energy audit.

And as I’ve stated multiple times including a previous blog on this website, this is not just about efficiency—this is also related to the health of building occupants. Building efficiency is related to human health. Period. And since America loves to brag about the American Dream of a “home sweet home,” it’s important that our homes are truly shelters from the elements, and safe from indoor pathogens as well.

Though sparse, there are some resources currently. These are:

  • A federal tax credit of up to $500 for energy auditing and to subsidize added insulation, efficient windows, doors and skylights. (Receipts must be shown and it covers a small percentage of the cost incurred.)
  • Community Action Agency that offers weatherization services free of charge for low-income homeowners and renters. They have an application process that requires income and utility bill information. Please follow the link to their website for more information.
  • And for alternative energy generation* a federal tax credit for installing “solar electric property, solar water heaters, geothermal heat pumps, small wind turbines, fuel cell property, and, starting December 31, 2020, qualified biomass fuel property expenditures paid or incurred in taxable years beginning after that date. The applicable percentages are:
    • In the case of property placed in service after December 31, 2019, and before January 1, 2023, 26%.
    • In the case of property placed in service after December 31, 2022, and before January 1, 2024, 22%.”
*Note: I will always argue that building owners must address energy-saving measures first prior to installing alternative energy generation. Otherwise, you’re just subsidizing waste; not to mention generation does not address inefficient attributes impacting your health and comfort.

MEC will be updating this on our website too as Build Back Better and utility companies ramp up more programs to help homeowners pay for upgrades. We are also here for you, renters and tenants, if you need us to answer any questions you may have concerning the efficiency of a building where you live. Please reach out – we’re just a phone call or email away.

We are funded by readers like you. Even $5 helps expand clean energy access.
Your donation helps scale new technologies—tools that are public-ready, but only utilized by people of moderate affluence at a minimum. Clean-energy technology is a game changer, not only for the planet, but also for small businesses and low-income households. Thank you for helping to broaden clean tech's horizons.

KANSAS CITY, Mo. (November 8th, 2021) – The U.S. Department of Energy has selected Metropolitan Energy Center (MEC) for a $5.2 million award to lead electric vehicle (EV) and charging station projects under the Low Greenhouse Gas (GHG) Vehicle Technologies Research, Development, Demonstration and Deployment program.  Funded projects will reduce diesel fumes in the air we breathe by supporting EV purchases, charging station installations, and outreach efforts to notify communities of these resources.  The funds will also help small businesses and rural cities accelerate their transition to electric vehicles in Missouri and Kansas.

As part of the award program, eight businesses and municipalities in Kansas and Missouri have pledged more than 15% of their own project budgets in contributions to help smaller communities qualify for federal cost-share matching requirements.  These businesses and muncipalities operate within environmental justice areas, opportunity zones, and other underserved areas. In addition to sedans, they are replacing small and heavy trucks with electric models.  Diesel emissions from heavy vehicles and off-road machinery contribute to early deaths, asthma rates and family illness keeping people away from jobs and school.  Those are just some of the health and social impacts from diesel fumes that affect the community members MEC serves.

Additionally, thanks to this award and generous overmatch contributions from some funding recipients, MEC can offer a small grant program for underserved communities.  Small grant recipients will define for themselves what project features would be locally most beneficial, like projects to install public EV charging stations in parking lots and curbsides near multi-unit residential complexes and retail businesses.  The success of the program depends upon placing EV charging stations within underserved or rural areas that feel the effects of environmental justice issues.

Executive director Kelly Gilbert said, “MEC will use our access to reach and empower communities in underserved urban and rural areas.  We will provide funds that communities can use in the ways that they decide will best meet their local needs.  We’ve seen that publicly funded EV chargers are even less likely than privately funded chargers to land in underserved areas, and it is important to change that trend.”

The award is expected to be finalized and the project to begin in early 2022; small grants are expected to be available in 2023.  Organizations interested in learning more about the upcoming small grant program opportunities should contact Miriam Bouallegue at miriam@mec.bluesym10.work.

We are funded by readers like you. Even $5 helps expand clean energy access.
Your donation helps scale new technologies—tools that are public-ready, but only utilized by people of moderate affluence at a minimum. Clean-energy technology is a game changer, not only for the planet, but also for small businesses and low-income households. Thank you for helping to broaden clean tech's horizons.

written by Kansas City Regional Clean Cities Coalition director David Albrecht

There are plenty of popular ideas floating around about alternative energy, and about energy in general.  Many are flawed, conspiratorial or just plain wrong.  Should we call them “myths”?  After all, a myth, even though supernaturally themed or wildly imaginative, can still be valid, revealing truths about human nature.  The Odyssey or the tales of King Arthur come to mind.  On the other hand, trying to explain something about the physical world by means of imaginative story-telling is a risky proposition.  A case in point:

Anyway . . .

We do have a reliable system in place which does a really good job of explaining the physical world.  It’s called “science”.  Perhaps “meme” is the best name with which to tag these ideas in the age of cloud-based, cloudy online information.  So, without further ado, here’s the first in a series of takes on popular memes about energy, renewable and otherwise – and what the data say.

The Deadly Menace of Wind Turbines . . . and Cats and Buildings and Cars . . .

Wind turbines can and do kill birds and bats.  Fish and Wildlife Service estimates for the US range from 140,000 to around 500,000 birds killed per year.  Songbirds account for the most fatalities, with raptors second.  Digression – weirdly enough, it appears that the cause of death, at least for bats, isn’t being struck by blades.  Instead, scientists have discovered that barotrauma (like the bends for scuba divers) may be the specific mechanism.  Sudden, dramatic air pressure changes near blade edges are believed responsible for rupturing the lungs of bats found dead in wind farms with no other signs of injuries.  End of digression.

As in real estate, optimal wind turbine placement is all about location.  This is true for the site in general, and where you place individual wind turbines within a given facility.  The original Altamont Pass wind farm (famously featured in the 80s movie “Less Than Zero”) in California is a classic example of a bad location, and was lethal to birds.  At its peak, over 6,000 small turbines, some dating back to the 1970s, ran at high speeds birds had no chance of avoiding.  At peak turbine count, Altamont Pass was killing more than 10,000 birds every year, including more than 2,000 eagles, hawks and owls.  The good news is that after years of pressure and delays, removal of the oldest and deadliest turbines began in 2015.  A complete replacement of 569 remaining 100 kW units with just 23 modern turbines was planned for completion by 2022.  Problems are likely to persist after the repower.  Even running at slower speeds, new turbines are so tall that their blades operate at the flight height of nocturnal migratory birds.  But since upgrades and removals began at Altamont, overall bird deaths have dropped there by between 40 and 50%.

                Where do wind turbines rank as a threat to wild bird populations?  Short version – very close to the bottom.  In 2018, the US Fish and Wildlife Service published its estimates for bird deaths by cause, drawn from multiple scientific studies.  Here are their low-range numbers:

  • Oil Pits:  500,000
  • Electrocutions:  900,000
  • Collision with electrical lines:  8,000,000
  • Poison:  72,000,000 (median estimate)
  • Collision with vehicles:  89,000,000
  • Collision with building glass:  365,000,000
  • Cats:  1,400,000,000
  • Wind Turbines – 234,000 (mean estimate)

Bear in mind that this total – 1,838,400,000 bird deaths – is the sum of low-range estimates (with the exception of poison).  High-range totals for the same categories produce an estimate of 3,536,700,000 annual bird kills through various human activities (and, of course, the activities of our four-footed, long-tailed furry friends).  Even high-end estimated totals of bird deaths through wind turbines (327,586) amount to a total of .0092% of total mortality in the same high-end estimate.  As wind power expansions continue, raw numbers of bird deaths will likely rise as well, but at a very low overall percentage of total mortality.

Wind Turbines And Human Health

The dangers of wind turbines to birds and bats are established.  To some degree, they can be mitigated.  What about us?  For years, studies and anecdotal evidence have shown there are issues with noise from turbines.  As noted by the College of Family Physicians of Canada, turbine noise can disrupt sleep, particularly as wind speed varies.  The consensus :  these issues are real, and reduce quality of life, and the closer people live to large turbines, the worse these problems.

Others living near wind farms have reported problems including headaches, fatigue and depression.  These have been blamed on the flickering shadows produced by blades, or on infrasound – sounds too low for humans to perceive.    However, an exhaustive study by the Council of Canadian Academies, which covered peer-reviewed, unpublished, and “gray literature” found only “limited” causal links between wind turbines and sleep deprivation.  Evidence of connections to more serious issues – vertigo, heart disease, diabetes – was “insufficient”.  In addition, other reports noted the following:

People living near wind turbines who received rent from them were “less likely to report adverse health effects” than other living nearby:

In two studies, two groups of test subjects were exposed either to silence, or to infrasound, through headphones after watching videos.  Those who watched a video warning of the dangers of infrasound were more likely to report symptoms and more severe symptoms from infrasound, even if they were exposed to silence.  Those watching a video minimizing the same dangers were less likely to report any symptoms.

To the best of our knowledge to date, the dangers to birds from wind power are real, but limited.  The dangers to people seem minimal, though noise exposure can be harmful.  And the successful uptake of a new technology doesn’t just mean the act of adopting it, but doing so carefully, with ourselves and the rest of the world in mind.

We are funded by readers like you. Even $5 helps expand clean energy access.
Your donation helps scale new technologies—tools that are public-ready, but only utilized by people of moderate affluence at a minimum. Clean-energy technology is a game changer, not only for the planet, but also for small businesses and low-income households. Thank you for helping to broaden clean tech's horizons.

written by Kansas City Regional Clean Cities Coalition director David Albrecht

Nuclear power may be America’s most controversial source of energy.  A dam can drown a stunning stretch of river.  Coal may loom larger in climate and public health debates, given its airborne pollutants and toxins buried in coal-ash dumps dotting the nation.  Solar-thermal plants, seen as environmentally benign, can incinerate birds in mid-flight.  Using any technology has consequences, but with nuclear power, they feel more . . . consequential.  It might be origins of nuclear power in the fires of World War II.  It could be echoes of Chernobyl or Fukushima.  Whatever the reason, bring up nuclear and you may generate heat that has nothing to do with physics.

The Nuclear Landscape

Whatever the opinions, these are the facts – 95 reactors at 57 plants in 29 states supply about 20% of America’s electricity.  As mentioned earlier in this series, nuclear plants are baseload plants.  They operate at maximum output nearly all the time, except when refueling or during maintenance.   The oldest active reactor came online in 1969, the newest in 2016 – the latter the first such in 20 years.  Two more reactors are now under construction in Georgia.  And though we’re down from 107 units operating in 2003 –upgrades and more efficient refueling mean total output is about the same as it was 17 years ago.  France remains the most nuclear-heavy country – more than 70% of its power comes from fission.  But in terms of total output, the US still leads the world.

It’s all driven by physics on a scale that’s hard to grasp.  Atoms of a few heavy, unstable elements like uranium are prone to split, or “fission”.  In the process, they release neutrons – neutral subatomic particles – and huge amounts of energy.  As those neutrons speed away, they hit other atoms.  Some of them split, releasing more neutrons and more energy.  That energy boils water, which generates steam, which turns a turbine – and so on into the grid.  Under controlled conditions, you’re in the control room of a nuclear power plant as smokeless fire converts steam to electricity.  Under uncontrolled conditions, you’re in the New Mexico desert on July 16th, 1945, as light brighter than the sun springs from the earth.

Keeping intense heat and potentially deadly radioactivity under control is an expensive, complex process.  American reactors are surrounded by massive containment domes of concrete and steel.  They’re cooled by networks of pumps and condensers backed up by multiply redundant systems in case of emergency or loss of power.  And given their fuel, they’re operated to the most exacting standards in any industry in terms of security.  All this adds up.  It’s not that nuclear power is all that expensive in terms of routine operations, fuel and maintenance.  EIA data show that between 2008 and 2018, these costs for fossil plants ranged from 3.5.to 4.1 cents per kilowatt-hour.  For hydropower, it was .9 to 1.2 cents and for nuclear, ranging from 2.1 to 2.7 cents.

Up-Front Costs vs. Climate Benefits

What has tilted the table against nuclear projects in recent years has been costs – driven by this need for safety.  An example:  the Tennessee Valley Authority began construction on its Watts Bar plant in 1974.  By the time a second reactor was done in 2016, total costs for the project hit $12 billion.  “Abundance of caution” fits the industry’s outlook.  After the Fukushima tsunami in 2013, new flood protection measures more than 6% to the costs of  that second TVA reactor.  And in Georgia, two new units for the Vogtle plant, first priced at $14 billion in 2009, are now estimated at $25.7 billion.

Despite high capital costs, nuclear power has one huge advantage over other forms of electricity in an era confronting climate limits.  It produces power without producing CO2 or other greenhouse gases.  Obviously, building plants and parts and refining fuel consume energy and generate greenhouse gases.  But nuclear plants – with up to nearly 4 gigawatts of capacity, and operating flat-out for months on end – do so without any GHGs.  With this in mind, there’s a big effort to extend the lives of nuclear plants now in service through the USDOE with improved materials, plant upgrades and risk analysis.

What’s Next?

There’s been a great deal of time and money invested in developing the next generation of nuclear technology.  We’re now in the fourth generation of plant designs, though none have gone beyond prototypes.  Some designs use water at very high pressure, others use helium or molten salt as coolants.  This next generation is designed to operate at higher temperatures, use much less fuel and generate way less waste.  Some new designs can use nuclear waste as fuel.  An additional important field is the development of passive safety designs – reactors that need no or minimal human intervention in emergencies.

Finally, given the high costs of nuclear, modular design is seen as the wave of the future.  Smaller, more efficient reactors could allow for deployments of this form of low-carbon power without the enormous costs seen in current projects.  Whether economic conditions and public opinion permit the deployment of this fourth generation will be one of the big climate/energy questions of the 2020s.

We are funded by readers like you. Even $5 helps expand clean energy access.
Your donation helps scale new technologies—tools that are public-ready, but only utilized by people of moderate affluence at a minimum. Clean-energy technology is a game changer, not only for the planet, but also for small businesses and low-income households. Thank you for helping to broaden clean tech's horizons.

On KKFI Radio’s show for 7/12/21, listeners had the opportunity to hear from Mary English, Energy Program Manager, Building Performance, and Miriam Bouallegue, Project Manager, Sustainable Transportation, both with Metropolitan Energy Center (MEC).

Eco Radio host Brent Ragsdale talked with Mary and Miriam and discussed two initiatives MEC is working on with Kansas City MO – the building benchmark ordinance and streetlight EV charging stations.

https://www.kcmo.gov/programs-initiatives/energy-and-water-benchmarking

https://mec.bluesym10.work/programs/current-projects/streetlight-ev-charging/

Tune in here for a recording of the discussion.

“We at EcoRadio KC are glad to encourage awareness and protection of our world. We can create a sustainable present for a sustainable future!”

It is understandable to freak out over climate change, but the challenge is … to work hard on this crisis while still enjoying life on what is still a beautiful planet.

https://kkfi.org/listen/

We are funded by readers like you. Even $5 helps expand clean energy access.
Your donation helps scale new technologies—tools that are public-ready, but only utilized by people of moderate affluence at a minimum. Clean-energy technology is a game changer, not only for the planet, but also for small businesses and low-income households. Thank you for helping to broaden clean tech's horizons.

written by Kansas City Regional Clean Cities Coalition director David Albrecht

Like many technologies, the windmill is nothing new.  People have been using the wind to grind grain and pump water for over a thousand years.  If not for the windmill, there’d be no Netherlands as we know it.  Settling America’s plains states during the 19th Century would have been nearly impossible.  But the use of wind to generate electricity at scale is new, going back only about 30 years.  In that short time, this evolving technology has produced the biggest single leap in renewable electricity output since the Age of Dams in the early-to-mid 20th Century.

In theory, generating electricity from wind is simple.  Air moves over the turbine blades, generating lift and setting the system in motion.  The shaft on which the blades are mounted rotates.  In doing so, it spins a magnet inside the generator’s windings, producing electricity.  Turbines can be direct-drive systems, but most use gearboxes to speed up their blades, since higher RPMs generate more efficiently.  The electricity produced by the turbines hits the grid and powers everything from toasters to cities.  Simple, no?

The Where Of American Windpower

Well, not quite.  There are more than a few complications.  Wind is generated by the sun’s heating of Earth’s surface, which is uneven.  Geography, climate and terrain add more variability.  Result – the wind blows reliably only in certain regions.  In America that means the Midwest , especially the Great Plains.  That’s why Texas leads the country in wind energy capacity, with Iowa, Oklahoma, California (outlier!) and Kansas in spots two through five.  And that’s why eight contiguous states in the southeast to date have zero installed capacity.

Onshore, the strongest winds blow in thinly populated states far from power-hungry big cities.  Transmission lines can cost millions of dollars per mile, and they’re not always popular, locally or politically.  And as the seasons change, so does the wind.  On the High Plains, America’s wind power sweet spot, output falls during the hottest months, when electrical demand for cooling spikes, rising again during winter.

Upsides – Income & Jobs

However, there are multiple benefits to wind.  Unlike coal or uranium, the wind is free.  Building turbines means leasing land.  Those leases bring in between $5,000 and $8,000 per unit per year to farmers or ranchers, though they can also limit construction and access by landowners. Turbine maintenance means turbine techs.  More than 7,000 Americans are already working in this fast-growing sector, with median pay of nearly $53,000 per year.

Efficiency keeps improving.  In much of America, the higher off the ground, the stronger the wind.  Taller turbines are taking advantage of that fact.  Between 2000 and 2018, average turbine height jumped nearly 100 feet, with bigger units providing more power.  And the environmental benefits of wind energy are substantial.  Beyond the carbon embedded in building and installing the systems, electricity from wind is carbon-free.  As markets for clean energy credits grow, and clean energy demand grows, so does the financial case for wind.

Rapid Growth And What’s Next

For all these reasons and more, wind’s growth has been simply explosive.  In 1990, wind provided 3 billion kWh, or about 0.1% of all electricity.  10 years later, it had doubled, and was still stuck at about 0.1% of the market.  Total share in following years:  2005 – 0.4%; 2010 – 2.3%; 2015 – 4.7%; 2019 – 7.3% – the same year that wind overtook hydropower.

But this intermittent (though clean) energy source has limits.  Surpassing those limits means going to sea.  That’s because offshore wind potential in the United States is about twice the nation’s current electricity demand.  But offshore wind power is almost non-existent here, with exactly one site currently up and operating.   Beyond that, grid upgrades and the addition of large-scale energy storage are going to be necessary for wind energy to make its next big jump.

We are funded by readers like you. Even $5 helps expand clean energy access.
Your donation helps scale new technologies—tools that are public-ready, but only utilized by people of moderate affluence at a minimum. Clean-energy technology is a game changer, not only for the planet, but also for small businesses and low-income households. Thank you for helping to broaden clean tech's horizons.

written by Kansas City Regional Clean Cities Coalition director David Albrecht

There’s a chewy chunk of truth in the perception that all-electric cars are expensive, because many of them are.  In June, 2019, the average cost for a new car stood at $36,600, compared to a $55,600 average for a battery-electric.  But averages conceal as well as reveal, so let’s keep on chewing.  For EVs, that average gets a substantial push skyward by plenty of high-end all-electric models.  Cases in point:  2021 BMW i3s:  $47,650; 2021 Mustang Mach-E Premium:  $52,000; 2021 Audi E-Tron:  $65,900; Tesla Model S Long Range:  $79,990; 2021 Porsche Taycan Turbo:  $150,900.  And so on.  Even the $7,500 federal tax credit, available for all these models except Tesla, isn’t going to make a big difference up there in the financial stratosphere – and most of us don’t live there anyway.

Back on earth, what about affordable new electric car options?  They’re out there.  Kelly Blue Book, reporting in September 2018, noted an average new car price of $35,742, and a total of 10 all-electric and 13 plug-in hybrid models with MSRP below that.  Less than three years later, choices have boomed.  As of April 2021 14 different makers offer 41 different all-electric models and trim levels; 21 OEMs have brought 45 different models and trims of plug-in hybrids to market.

Whatever the price, a new car is always a substantial expenditure.  At this point, Wentworth J. Stumblewhistle III – your inner CPA – should chime in with a reminder that an automobile is, in fact, a depreciating asset, not an investment.  With that in mind, what’s the best way to avoid some of the financial burden of a new car – the depreciation hit when you drive off the lot, sales and personal property tax, insurance? What about a used car?  Specifically, what about a used electric car?

When it comes to EVs, there are advantages to buying used that add up in an even bigger way than for a conventional model, and we’re happy to walk you through some of them.   For starters, depreciation has tended to be steeper with many all-electric models than it has been for conventional cars.  This isn’t true for some brands.  Used Teslas tend to hold their value longer than most EV brands – but that’s not really the market we’re looking at here anyway.

Some handy examples from CarGurus:  A 2020 Hyundai Ioniq SE EV, with 1,058 miles for $18,999.  MSRP for a new version of the same year, make and model – $34,295.  Even with the $7,500 federal tax credit that’s still nearly $8,000 cheaper with barely 1,000 miles on the odometer and an estimated range of 170 miles per charge.  A 2020 Chevy Bolt, with a starting new  MSRP of $36,620 and an estimated range per charge of 259 miles:  with just 3,030 miles, $22,519.  Older models are even more affordable:  A 2017 Nissan LEAF with 18,974 miles on the odometer and an estimated 107-mile range – $12,575.  (Disclaimer – These specific listings are only illustrations, and we’re not endorsing any specific brand, model or dealership.  And by the time this is published, these links may not work anyway, as the cars listed may have sold.)

So, what’s the catch?  After all, if it sounds too good to be true . . . Let’s just say it’s complicated.  For starters, all electric vehicles lose battery capacity over time.  This doesn’t mean they’re bad cars – that’s just the nature of batteries as they charge and discharge thousands of times.  A fairly extensive study of 6,300 electric cars, covering 64 different makes and model years came out in July 2020.  It found an average annual capacity loss of about 2.3% from time of purchase.  In other words, a new EV purchased today with a range of 150 miles should have a range of about 133 miles in 2026.  So, does the 2017 Nissan LEAF listed above still have a range of 107 miles 6 years after it was sold?  Probably not.

There are other variables in play when considering a used EV.  Beyond age and mileage, where was the car driven?  High temperatures can mean faster loss of EV battery capacity, so buying a used EV in Portland might be better than buying one in Phoenix.  How was it charged?  Some studies indicate that frequent use of high-speed charging can substantially cut into battery capacity, in some cases after a few dozen high-speed charging sessions.  Scientists are already working to find ways to work around this issue, through improved battery design and improved charging cycles.  But how much high-speed charging a pre-owned EV used isn’t the kind of information you’ll find in a Carfax.

Another issue is geographic, not technical.  Many manufacturers sell EVs only in certain areas of the country, particularly in California and the Northeast.  Accordingly, those are the areas where you’re most likely to find a used EV that fits your needs.  This means that you may have to travel to an out-of-state dealership and drive back or pay to have the car trucked to where you live.  Car shipping costs in April 2021 averaged between $800 and $1000 – not insurmountable, but still a substantial expense.

Yet even with all these considerations in the mix, there are substantial long-term advantages to electric autos compared with conventional models.  Service costs are nominal.  Without gasoline, oil, coolant or transmission fluid, routine maintenance is reduced to software updates and tire rotation, plus the occasional brake check.  Beyond the complexities of software and battery control systems, EVs are remarkably simple machines, with fewer possible points of failure and lower total costs of ownership.

Data to date support this.  Consumer Reports published a study in fall of 2020 that tracked long-term costs of nine different models of electric cars.  “For all EVs analyzed, the lifetime ownership costs were many thousands of dollars lower than all comparable ICE (internal combustion engine) vehicles’ costs, with most EVs offering savings of between $6,000 and $10,000.  While new EVs were found to offer significant cost savings over comparable ICE vehicles, the cost savings of 5-to-7 year old used EVs was found to be two to three times larger on a percentage basis.”

Electric cars won’t work for everyone.  But for those interested in making the switch, yet leery of new car prices, an affordable used model may be a viable option.  And remember, whatever you’re looking to drive home, the sticker price isn’t the cost of a car – it’s only the first installment.  Total cost of ownership is, in the end, the best way to measure how long and how much you’ll be paying for personal transportation.

We are funded by readers like you. Even $5 helps expand clean energy access.
Your donation helps scale new technologies—tools that are public-ready, but only utilized by people of moderate affluence at a minimum. Clean-energy technology is a game changer, not only for the planet, but also for small businesses and low-income households. Thank you for helping to broaden clean tech's horizons.